Key takeaways
- Toronto's 2025 average was 119 mg/L as calcium carbonate, with a low of 115 and a high of 122. That is 7.0 grains per US gallon.
- Every Lake Ontario figure in the GTA sits between 115 and 130 mg/L. Twenty-one of the 22 figures on wells run from 186 to 420 mg/L, topping out at Cheltenham in Caledon.
- Milton and Georgetown each have two figures, not one. Halton reports Milton at 126 mg/L on the lake side and 318 on the well side, and Georgetown at 125 and 342.
- Health Canada sets no objective for hardness. The 80 to 100 mg/L line printed on GTA water reports is Ontario's operational guideline for choosing a water source.
- GE Appliances recommends a softener above 12 grains per US gallon, which works out to 205.2 mg/L. Eighteen of the 46 figures are above that line, and every one of them draws on wells.
If your tap runs on Lake Ontario, your water sits between 115 and 130 mg/L of hardness. That covers Toronto, Mississauga, Brampton, Markham, Richmond Hill, Vaughan, Oakville, Burlington and the Durham lakefront. If your tap runs on a well, it is usually far higher. Twenty-one of the 22 figures on wells run from 186 to 420 mg/L, topping out at Cheltenham in Caledon. The 22nd, Ansnorveldt in King, is softer than Toronto. Nothing here is soft water, and nothing sits inside Ontario's 80 to 100 mg/L guideline. The split that matters is lake against well, not city against city, and two towns are on both.
Every GTA figure, from the utility that publishes it
Hardness is the dissolved calcium and magnesium in your water. Utilities report it in milligrams per litre as calcium carbonate, written mg/L. Parts per million, or ppm, is the same number. Softener labels use grains per gallon instead. One grain per US gallon is 17.1 mg/L, a figure GE Appliances states outright and Health Canada's own conversion table works out to, so the grains column is mg/L divided by 17.1.
We read the figure each GTA utility publishes for its own supplies, 46 in all. A row is a published figure, not a plant and not a system. York reports Markham, Richmond Hill and Vaughan separately, though its own footnote says the three are one York Water System. Toronto prints one figure for four plants. Durham says it runs "14 drinking water systems" and publishes nine figures.
The periods differ too, so every row carries its own: 2025 annual averages from Toronto and Halton, 2026 second-quarter averages from York, 2025 ranges from Peel, and no year at all from Durham. To grade a row, use the scale York Region publishes: soft 0 to 60, moderately hard 61 to 120, hard 121 to 180, very hard above 180 mg/L. Ansnorveldt and Peel's Lorne Park zone are the only figures wholly inside the moderately hard band. Toronto's 119 average is inside it, its 2025 range reaches 122, and Peel's Arthur P. Kennedy range starts on its top edge. Everything from 186 up is very hard.
| Community or zone | mg/L | US grains | Source water | Utility, period |
|---|---|---|---|---|
| Toronto (all plants) | 119 avg (115 to 122) | 7.0 | Lake Ontario | Toronto, 2025 |
| Mississauga/Brampton (Lorne Park) | 120 | 7.0 | Lake Ontario | Peel, 2025 |
| Mississauga/Brampton (Arthur P. Kennedy) | 120 to 130 | 7.0 to 7.6 | Lake Ontario | Peel, 2025 |
| Burlington (Snake Road) | 122 | 7.1 | Not stated | Halton, 2025 |
| Oakville | 124 | 7.3 | Lake Ontario | Halton, 2025 |
| Burlington | 124 | 7.3 | Lake Ontario | Halton, 2025 |
| Burlington (Bridgeview) | 125 | 7.3 | Not stated | Halton, 2025 |
| Burlington (North Aldershot) | 125 | 7.3 | Not stated | Halton, 2025 |
| Georgetown (lake zone) | 125 | 7.3 | Lake Ontario | Halton, 2025 |
| Pickering, Ajax, Whitby, Brooklin, Oshawa, Bowmanville, Newcastle | 125 | 7.3 | Lake Ontario | Durham, no year |
| Milton (lake zone) | 126 | 7.4 | Lake Ontario | Halton, 2025 |
| Markham | 126 | 7.4 | Lake Ontario | York, 2026 Q2 |
| Richmond Hill | 127 | 7.4 | Lake Ontario | York, 2026 Q2 |
| Vaughan | 128 | 7.5 | Lake Ontario | York, 2026 Q2 |
| Kleinburg | 133 | 7.8 | Not stated | York, 2026 Q2 |
| Georgina | 144 | 8.4 | Lake Simcoe | York, 2026 Q2 |
| Beaverton | 148 | 8.7 | Lake Simcoe | Durham, no year |
| Keswick | 150 | 8.8 | Lake Simcoe | York, 2026 Q2 |
| Aurora | 130 | 7.6 | Lake and wells | York, 2026 Q2 |
| King City | 131 | 7.7 | Lake and wells | York, 2026 Q2 |
| Newmarket | 141 | 8.2 | Lake and wells | York, 2026 Q2 |
| Queensville | 160 | 9.4 | Lake and wells | York, 2026 Q2 |
| Holland Landing | 168 | 9.8 | Lake and wells | York, 2026 Q2 |
| Stouffville | 318 | 18.6 | Lake and wells | York, 2026 Q2 |
| Ansnorveldt | 116 | 6.8 | Wells | York, 2026 Q2 |
| Uxbridge | 186 | 10.9 | Wells | Durham, no year |
| Caledon Village, Mono Mills, Skywood | 190 to 280 | 11.1 to 16.4 | Wells | Peel, 2025 |
| Inglewood | 200 | 11.7 | Wells | Peel, 2025 |
| Ballantrae | 205 | 12.0 | Wells | York, 2026 Q2 |
| Palgrave | 240 to 250 | 14.0 to 14.6 | Wells | Peel, 2025 |
| Nobleton | 264 | 15.4 | Wells | York, 2026 Q2 |
| Schomberg | 264 | 15.4 | Wells | York, 2026 Q2 |
| Port Perry | 274 | 16.0 | Wells | Durham, no year |
| Greenbank | 276 | 16.1 | Wells | Durham, no year |
| Caledon East, Centreville, Cedar Mills | 280 to 360 | 16.4 to 21.1 | Wells | Peel, 2025 |
| Orono | 309 | 18.1 | Wells | Durham, no year |
| Cannington | 312 | 18.2 | Wells | Durham, no year |
| Blackstock | 316 | 18.5 | Wells | Durham, no year |
| Mount Albert | 317 | 18.5 | Wells | York, 2026 Q2 |
| Milton (well zone) | 318 | 18.6 | Wells | Halton, 2025 |
| Alton | 320 to 330 | 18.7 to 19.3 | Wells | Peel, 2025 |
| Acton | 324 | 18.9 | Wells | Halton, 2025 |
| Georgetown (well zone) | 342 | 20.0 | Wells | Halton, 2025 |
| Sunderland | 345 | 20.2 | Wells | Durham, no year |
| Campbellville | 350 | 20.5 | Wells | Halton, 2025 |
| Cheltenham, Terra Cotta | 410 to 420 | 24.0 to 24.6 | Wells | Peel, 2025 |
Three rows carry a warning. Ansnorveldt is a well system in the moderately hard band, so a well does not always mean hard water. Stouffville is the one high figure York calls a lake and well blend rather than pure well water. And Peel's Inglewood report prints 200 mg/L and 10.50 grains per US gallon on the same line, which do not agree, since 200 divided by 17.1 is 11.7 grains. The raw water row in the same report does agree at 17.1. We corrected neither Peel figure.
Why well towns run so much harder
"Groundwater is usually harder than surface water because it travels slowly through sediments that are rich in calcium and magnesium," York Region says. Durham says the same of its own supply. Water that soaks through rock picks up more of them, and lake water picks up less. York then qualifies its own point: the water from Lake Simcoe and Lake Ontario "tends to be hard" as well, so the lake belt is a floor rather than soft water.
So the map ignores city boundaries. "Peel has two drinking water sources: Lake Ontario and groundwater wells in Caledon," the Region says. Brampton drinks the lake water at 120 to 130 mg/L. Cheltenham, in the same region, drinks well water at 410 to 420.
Two towns have two numbers, not one
Milton and Georgetown are each split down the middle. "Under normal operating conditions, lake water and groundwater do not mix in Milton's distribution system," Halton's 2025 Milton report says. The Georgetown report says the same, and adds that part of Georgetown joined the lake-based system on 5 November 2024.
So Milton is 126 mg/L or 318, depending on the pipe outside your house, and Georgetown is 125 or 342. Any chart giving either town one number is wrong for one of its two zones, and Georgetown's lake zone is newer than most of those charts.
What actually counts as hard
There is no single Canadian scale. Health Canada's guideline document prints six published schemes side by side and says "different ranges to characterize these classifications are encountered in the literature". Two of the six disagree about whether 130 mg/L water is moderately hard or hard. We use York Region's scale, a GTA utility's own, which matches the United States Geological Survey row of that table.
Health Canada sets no target for hardness at all. Its aesthetic objectives, the levels set for taste, smell and look rather than health, cover chloride at 250 mg/L or less, sulphate and total dissolved solids at 500 or less each, and sulphide at 0.05 or less. Hardness is not on that list. The health side is just as blunt. The document says there is "insufficient evidence to support the need for" a maximum acceptable concentration or a health-based value for hardness. A health-based value is the amount it says "can be consumed over a lifetime without significant health risk".
So the 80 to 100 mg/L line printed on your water report is Ontario's. Ontario's technical support document says the guideline "is set at between 80 and 100 mg/L as calcium carbonate". The next line says why: "This value is set to aid in water source selection where a choice exists". It helps a utility pick a source, and no GTA figure is inside it.
What the softener pages publish, next to the utility's figure
Six of the nine results on this search sell softeners, filters or plumbing, and five publish a GTA number. Eighteen of those figures are set out here, each beside the utility's own for the same water.
| Retailer | Community | Retailer figure | Utility figure |
|---|---|---|---|
| Watermart | Brampton | 200 to 250 mg/L, "One of the hardest in the GTA" | 120 to 130 and 120 (Peel, 2025) |
| Go Lime | Brampton | 200 to 250 mg/L | 120 to 130 and 120 (Peel, 2025) |
| Watermart | Markham | 150 to 200 mg/L | 126 (York, 2026 Q2) |
| Watermart | Richmond Hill | 150 to 190 mg/L | 127 (York, 2026 Q2) |
| Watermart | Newmarket | 160 to 200 mg/L | 141 (York, 2026 Q2) |
| Watermart | Milton | 140 to 170 mg/L | 126 lake zone, 318 well zone (Halton, 2025) |
| Watermart | Burlington | 130 to 150 mg/L | 124 (Halton, 2025) |
| Watermart | Oakville | 120 to 140 mg/L | 124, inside the range (Halton, 2025) |
| Watermart | Toronto | 120 to 140 mg/L | 115 to 122, average 119 (Toronto, 2025) |
| Go Lime | Toronto | 120 to 140 mg/L | 115 to 122, average 119 (Toronto, 2025) |
| Aquatell | Brampton and Mississauga | 7 to 7.6 grains | 7.0 to 7.6 US grains (Peel, 2025) |
| Aquatell | Oakville | 8.5 grains | 7.3 US grains, 8.7 imperial (Halton, 2025) |
| Aquatell | Georgetown | 23.6 grains, one value | Well zone 20.0 US grains or 24.0 imperial, lake zone 7.3 US or 8.8 imperial (Halton, 2025) |
| Aquatell | New Toronto, North York Twsp. | 7 to 8.3 grains, listed as two places | One system, 7.0 US grains, average 119 mg/L (Toronto, 2025) |
| Excalibur | Oshawa | 5.3 grains | 125 mg/L, or 7.3 grains (Durham) |
| Excalibur | Uxbridge | 10.9 grains | 186 mg/L, or 10.9 grains (Durham) |
| Excalibur | Toronto | 6.8 grains | 7.0 US grains, average 119 (Toronto, 2025) |
| Coway | Toronto | 116 to 131, average 121, cited to the City's 2024 summary | 116 to 131, average 121 in 2024 (Toronto) |
Three patterns come out of those eighteen rows.
The first is Brampton. Watermart and Go Lime both put it at 200 to 250 mg/L and call it among the hardest water in the GTA. Peel's own 2025 report, titled "Brampton, Mississauga and South Caledon", puts the water Brampton drinks at 120 to 130, among the softest in the region.
The second is units. Aquatell's list runs a single column headed "gpg". Its Brampton entry, 7 to 7.6, is exactly Peel's grains per US gallon. Its Georgetown entry of 23.6 and its Oakville entry of 8.5 track Halton's grains per imperial gallon, about a fifth larger for the same water. It also carries New Toronto and North York Twsp., two municipalities that no longer exist.
The third is that the gaps run in both directions. Excalibur puts Oshawa at 5.3 grains, about 91 mg/L, well under Durham's published 125. Watermart's Oakville range of 120 to 140 brackets Halton's 124.
Three of the eighteen rows match the utility's own figure exactly, and all three reproduce a number the utility publishes. Aquatell's Brampton grains are Peel's. Excalibur's Uxbridge 10.9 grains is Durham's 186 divided by 17.1. Coway cites 116 to 131 mg/L, average 121, to the City's 2024 summary, and that summary says exactly that. It is one publication behind: the 2025 summary reports 115 to 122, average 119. The same page credits the 80 to 100 range to Health Canada, whose document does carry it, but as a suggestion from the literature dated 1968 rather than its own recommendation.
What your number means at home
The one threshold with a number behind it
GE Appliances draws a line. "Anything over 12 gpg is very hard, and a water softener is recommended," its support page says. Twelve grains times 17.1 is 205.2 mg/L, or 205.4 at the 17.118 that same page converts with. Eighteen of the 46 figures are above that line, and every one draws on wells, Stouffville's lake and well blend included.
Two more are borderline, not over it. Ballantrae's 205 mg/L divided by 17.1 is 11.99 grains, which the table rounds to 12.0 and GE's wording leaves just under. Caledon Village's published range of 190 to 280 crosses it.
No lake-supplied community is close. Toronto is 7.0 grains, the two Peel plants top out at 7.6, Vaughan is 7.5, and the Lake Simcoe systems reach 8.8 at Keswick.
Two grain scales, one dishwasher
Halton labels its grains row "(for Dishwashers)" and converts with its own note: "mg/L x 0.07016 = grains/imperial gallon". GE's detergent guide runs on US gallons instead. Oakville's 124 mg/L is 7.3 US grains and 8.7 imperial grains. GE's medium band stops at 8 grains and two thirds of a detergent cup. Its hard band starts at 9 grains and a full cup. The US figure sits inside medium. The imperial figure falls in the gap between the two bands, which GE covers only with "anything in between will require judgment". Same water, two different answers, so check which gallon a chart means.
Kettles, soap and the hot water tank
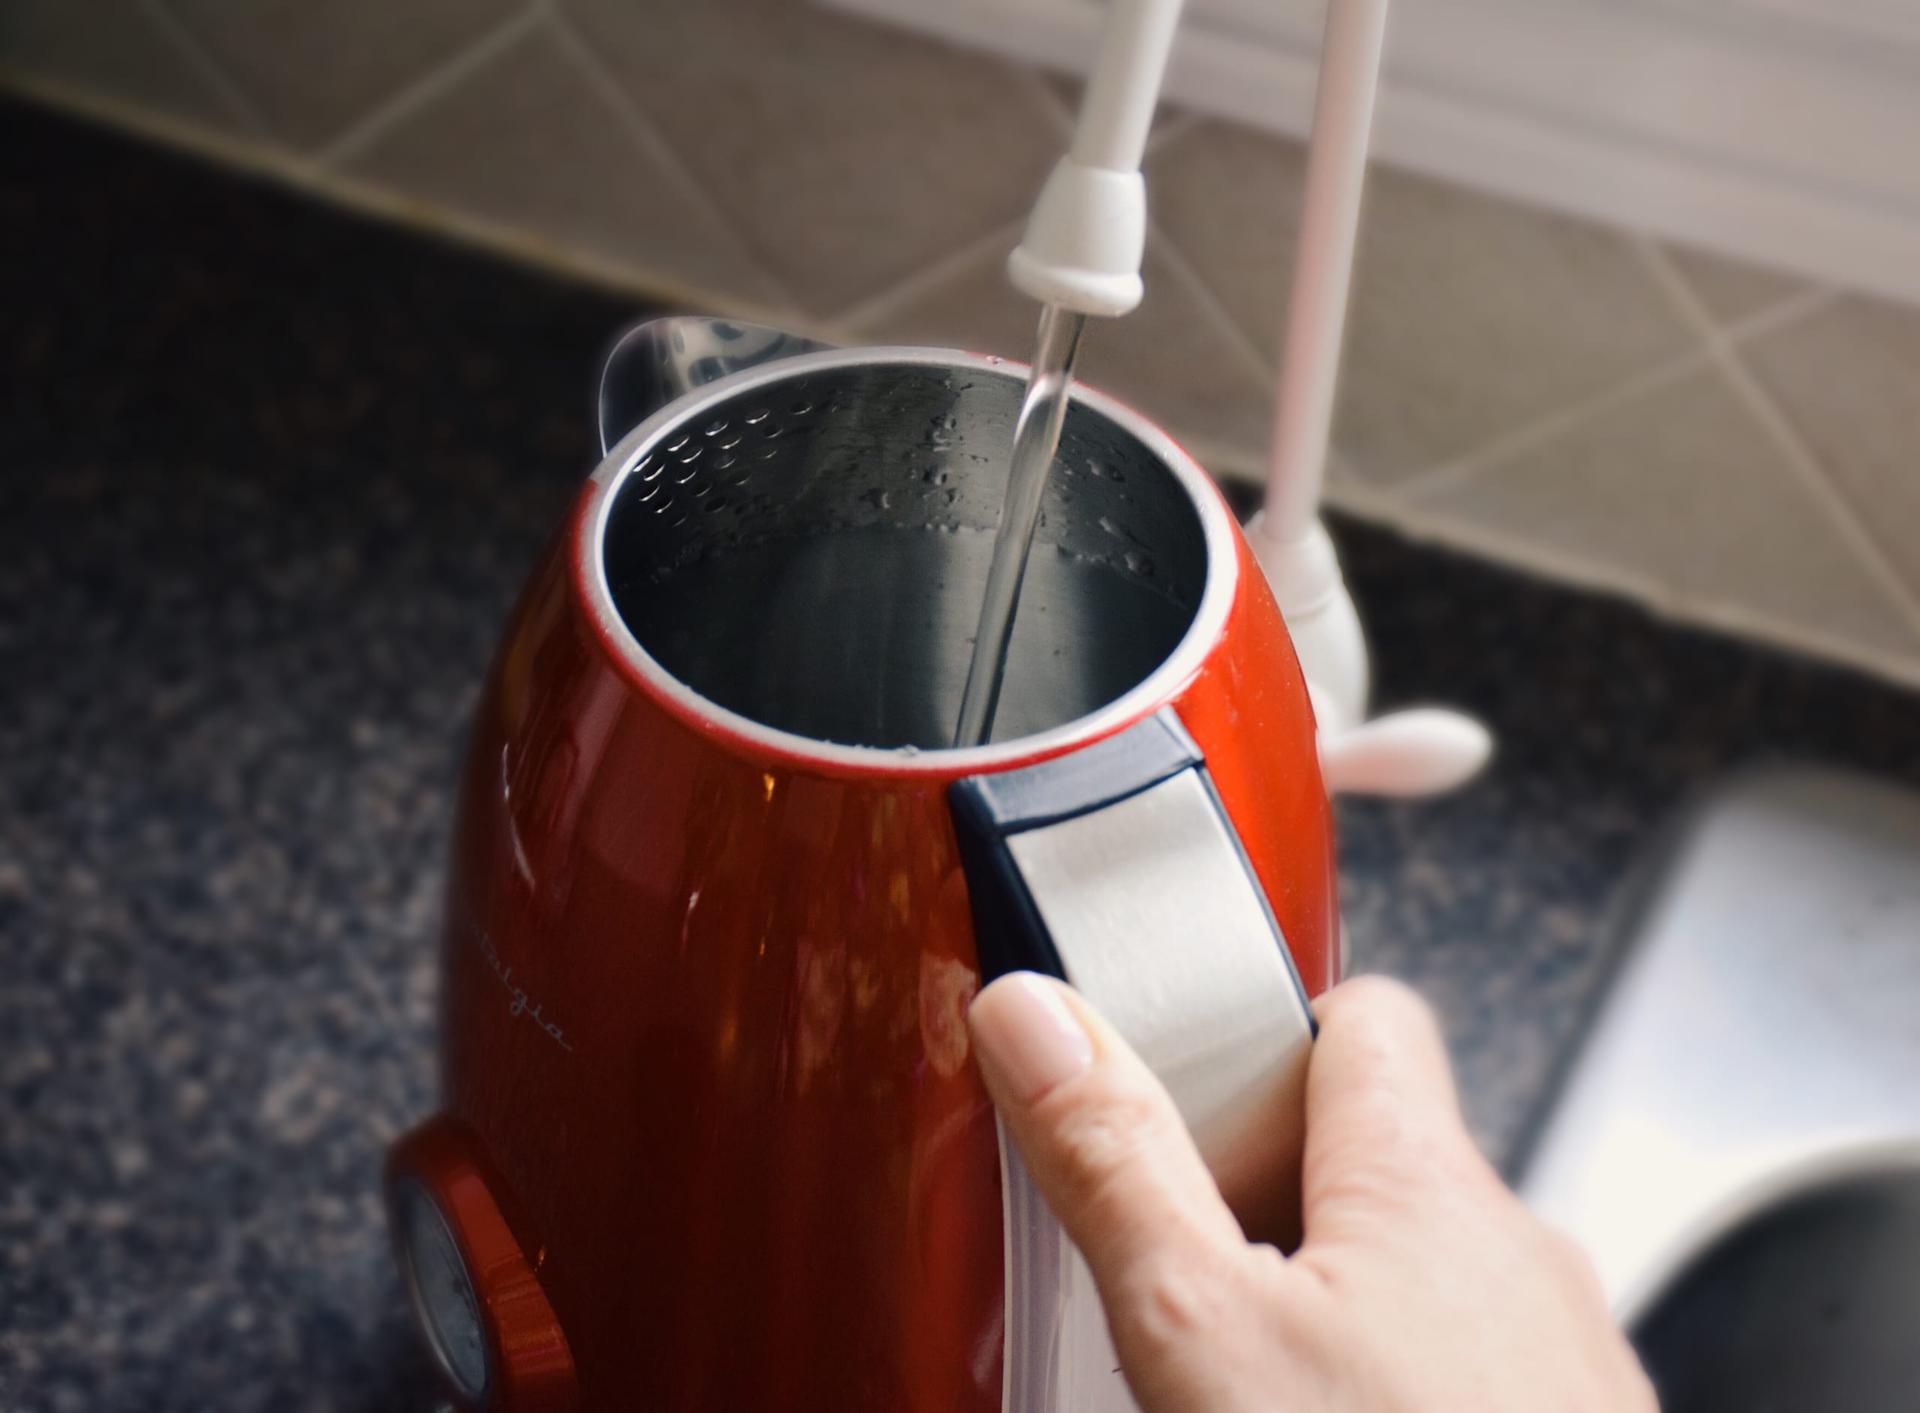
Peel explains the white film. When water is boiled, it says, "calcium and magnesium precipitate out of the water and deposits on the heating element and inner surfaces of the kettle". The deposit is harmless and "can be removed by regular rinsing with vinegar or lemon juice".
Health Canada covers the rest. "Hard water requires a considerable amount of soap to produce a lather", and deposits in hot water tanks "can impede heat transfer resulting in lower energy efficiencies and premature failure". Neither Health Canada nor GE puts a percentage on that loss, so neither do we.
The sodium a softener adds
A softener swaps calcium and magnesium for sodium. Health Canada's Appendix E puts numbers on that trade: 100 mg/L of hardness adds 46 mg/L of sodium, 200 adds 92, and 500 adds 230. That is 0.46 mg/L of sodium per 1 mg/L of hardness, at all three points.
Run it against Halton's hardest system. Campbellville is 350 mg/L hard, a small well supply Halton says serves "approximately 35 households". Halton measured its sodium at 126 mg/L in 2025, before any softening. Softening it fully would add 350 x 0.46 = 161 mg/L, for a total near 287. Ontario's aesthetic objective for sodium is 200 mg/L, printed in Halton's own footnote, and 20 mg/L already means notifying the Medical Officer of Health. That is arithmetic on a published table, not a measurement of anyone's tap. None of the five retailer pages we read puts a sodium number beside its hardness number.
Health Canada's answer sits in the same appendix. When a softener is used, it says, "it is recommended that a portion of the water most frequently consumed (such as from the kitchen tap) bypass the softener altogether". York suggests the same, a separate un-softened supply for cooking and drinking.
How to check your own supply
Go to the utility, not to a chart. Toronto publishes a yearly Drinking Water Analysis Summary covering all four plants. Peel publishes one report per system. York updates its table by community every quarter. Durham lists its systems on its About Water page, a table with no measurement year whose values match the Internet Archive copy from 5 December 2023. Halton publishes a 2025 averages sheet for its 11 distribution systems.
Durham publishes a warning about door-to-door water sales
If a salesperson turns up "claiming to be partners with the Region", Durham says to "call and confirm with our office at 905-668-7711", extension 3488. The same page says a softener or filter "is a personal preference and not required with the Region's supplied water".
Hardness is not regulated under O. Reg. 170/03, so it need not appear in a utility's yearly report. We searched Durham's Oshawa, Whitby and Ajax, Port Perry, Uxbridge and Sunderland reports, and Halton's Acton, Milton and Halton Region reports, for the word "hardness" and found none, though every other parameter read cleanly.
Frequently asked questions
Is Toronto water hard or soft?
Neither, on York Region's scale. The City's 2025 average was 119 mg/L, at the top edge of the moderately hard band of 61 to 120. It is a close call: the 2024 average was 121, which is hard, and 2025 ran from 115 to 122.
Who has the hardest water in the GTA?
Cheltenham, in Caledon, at 410 to 420 mg/L in Peel's 2025 report, roughly three and a half times Toronto's 119. Campbellville in Halton comes next at 350, a system of about 35 households, then Sunderland in Durham at 345. Peel's Caledon East range reaches 360. We surveyed the GTA only, not the province.
How do I find the water hardness in my area?
Go to the utility that treats your water. All five pages are linked above; York's updates quarterly. On a private well none apply, and you need your own test.
How much hardness in water is okay?
No Canadian authority sets a limit, and York Region says there are "currently no known negative health effects related to water hardness". Ontario's 80 to 100 mg/L guideline exists "to aid in water source selection", a utility's decision rather than a household's. Health Canada calls supplies above 200 mg/L "poor but have been tolerated by consumers", and above 500 unacceptable for many domestic uses.
What is Toronto's water hardness in ppm?
119 ppm, on the 2025 average. Parts per million and milligrams per litre are the same number in water. In grains per US gallon that is 7.0.
Is Brampton's water harder than Mississauga's?
No. Both cities are fed by the same South Peel system, and Peel reports them together: 120 mg/L for the Lorne Park zone and 120 to 130 for the Arthur P. Kennedy zone. Which plant serves your street matters more than which city you live in.
Do I need a water softener in Toronto?
The City's own page says water softening systems are "usually not needed", and Peel and Durham both call a softener a personal preference. The one numeric threshold we found is GE's 12 grains per US gallon, or 205.2 mg/L. Toronto is 7.0 grains. Eighteen of the 46 figures are above GE's line, all of them drawing on wells.
Sources (26)
- Drinking Water Analysis Summary 2025 (all plants and distribution) · City of Toronto (retrieved )
- Drinking Water Analysis Summary 2024 · City of Toronto (retrieved )
- Tap Water in Toronto · City of Toronto (retrieved )
- 2025 Water Quality Report: Brampton, Mississauga and South Caledon · Region of Peel (retrieved )
- 2025 Water Quality Report: Caledon Village, Alton, Mono Mills and Skywood · Region of Peel (retrieved )
- 2025 Water Quality Report: Palgrave, Caledon East, Centreville and Cedar Mills · Region of Peel (retrieved )
- 2025 Water Quality Report: Inglewood · Region of Peel (retrieved )
- 2025 Water Quality Report: Cheltenham and Terra Cotta · Region of Peel (retrieved )
- Drinking Water Quality and Monitoring (quarterly hardness by community) · York Region (retrieved )
- About Water (water hardness concentrations) · Region of Durham (retrieved )
- Halton Region Distribution Water System 2025 Analytical Averages · Halton Region (retrieved )
- 2025 Drinking Water Quality Report: Milton Treatment and Distribution Subsystem · Halton Region (retrieved )
- 2025 Drinking Water Quality Report: Georgetown Drinking Water Subsystem · Halton Region (retrieved )
- 2025 Drinking Water Quality Report: Acton Drinking Water Subsystem · Halton Region (retrieved )
- 2025 Drinking Water Quality Report: Campbellville Drinking Water System · Halton Region (retrieved )
- 2025 Drinking Water Quality Report: Burlington, Burloak and Oakville Water Treatment Plants and Halton Region Distribution Subsystem · Halton Region (retrieved )
- Guidelines for Canadian Drinking Water Quality: Operational Parameters (hardness) · Health Canada (retrieved )
- Technical Support Document for Ontario Drinking-Water Quality Standards, Objectives and Guidelines (revised June 2006) · Ontario Ministry of the Environment, hosted by the Walkerton Clean Water Centre (retrieved )
- Water Hardness: How to Check for Hard Water · GE Appliances (retrieved )
- Dishwasher: Detergent Use and Water Hardness · GE Appliances (retrieved )
- Definition of Grains Per Gallon · GE Appliances (retrieved )
- Water Hardness Level by City in Ontario · Watermart (retrieved )
- Ontario Water Hardness Levels · Aquatell (retrieved )
- Water Hardness Levels by City · Excalibur Water Systems (retrieved )
- Toronto Hard Water: What It Does to Your Drinking Water, Kettle and Coffee · Coway Canada (retrieved )
- Water Hardness in Ontario: City-by-City Levels and What They Mean · Go Lime (retrieved )
How this guide was made
Read on August 27, 2026: the 46 hardness figures the five GTA water utilities publish (City of Toronto, Region of Peel, York Region, Region of Durham, Halton Region), each covering a plant zone, a community or a group of communities on one system, plus Health Canada's operational parameters guideline, Ontario's technical support document, three GE Appliances support pages, and the five retailer pages on this search that publish a GTA hardness number.